Stage 5: FL Training
On this page
The actual FL training takes place during this stage. For our base-case scenario, the processes are as described in the FL Overview. Because the base case should be as fast as possible, it only trains for 3 rounds. The following demo shows how a CLI user can inspect the running actors to observe the training rounds.
In the end, the aggregator sends the observer service the final/best-achieved trained model metrics, including accuracy and loss. The aggregator notifies the FLOps manager, which undeploys and removes the FL actors.
Observing FL Training & Results via the GUI
Instead of looking at service logs you can observe this training process via a sophisticated GUI. This GUI allows users to monitor, compare, store, export, share, and organize training runs, metrics, and trained models during training time and beyond.
FLOps uses MLflow to power its observability and tracking features. The aggregator is augmented with mlflow to track its global training process after each training round. The learners are not using mlflow to maximize privacy and minimize the introduction of further backdoors for attacks.
Different options are available to access the URL of this GUI. The easiest way to access this GUI in your browser is to inspect the tracking service (e.g., via the oak-cli). The URL will be reachable if you combine the tracking service’s public IP and port 7027.
╭─────────────────────────────────────────────────────────────────────────────────────────────────────────╮
│ name: trackinge3afed0047b0 | NODE_SCHEDULED  | app name: observatory | app ID: 679ddbcb7d55a8507c5cb58a │
├─────────────────────────────────────────────────────────────────────────────────────────────────────────┤
│ 0 | RUNNING    | public IP: 192.168.178.74 | cluster ID: 679cba79af4c1923eb5df1ae | Logs :              │
├─────────────────────────────────────────────────────────────────────────────────────────────────────────┤
│ ...                                                                                                     │
╰─────────────────────────────────────────────────────────────────────────────────────────────────────────╯
In this case, the GUI will be accessible under http://192.168.178.74:7027.
FLOps uses MLflow’s GUI and does not modify it. Therefore, this wiki only provides a brief selection of impressions of the GUI. MLflow is a feature-rich and well-documented MLOps tool. Excellent further details and extended capabilities are explained directly at MLflow.
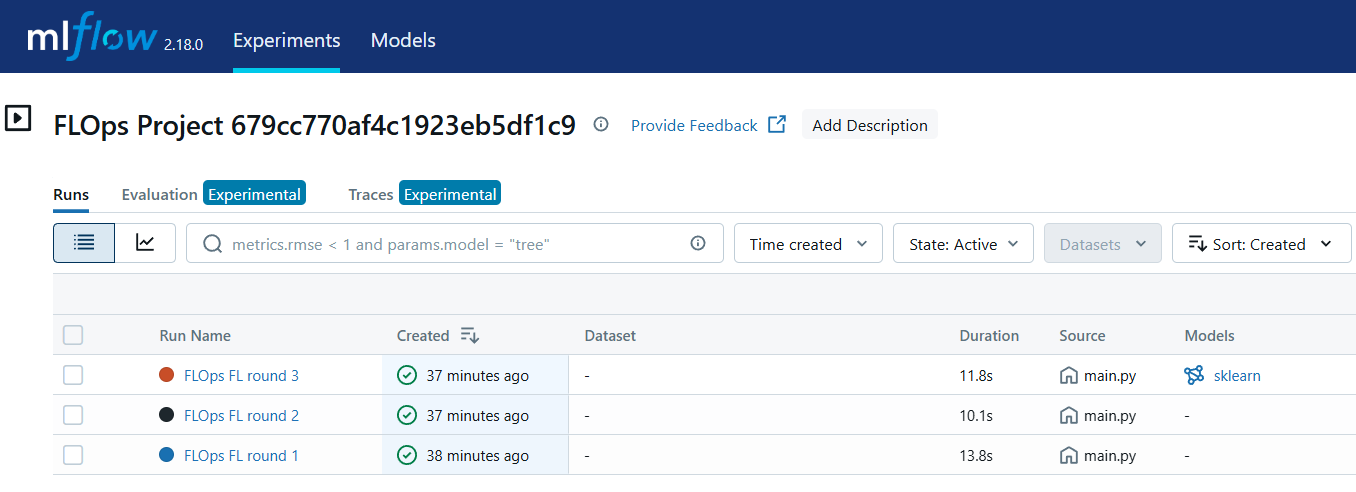
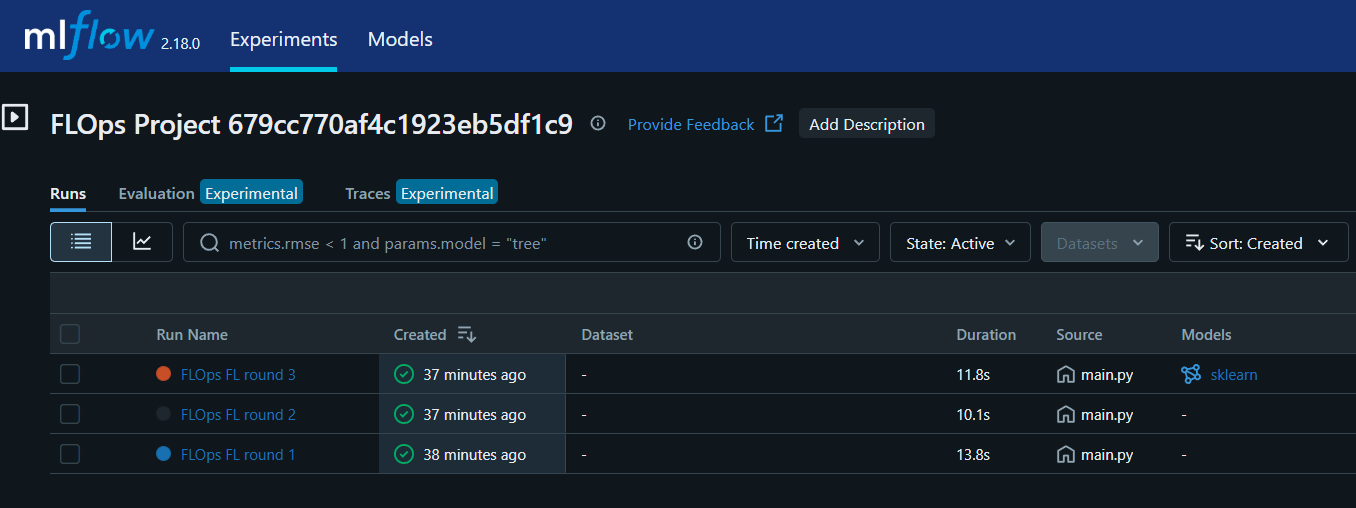
The left column (which is collapsed) lists all recorded experiments/projects. Only a single experiment is currently selected. Multiple experiments can be selected simultaneously to view their combined contents. The centerpiece offers a table view of the different FL rounds. Each table row depicts a single FL round, when it was recorded, and its duration. Only the best round contains a logged model.
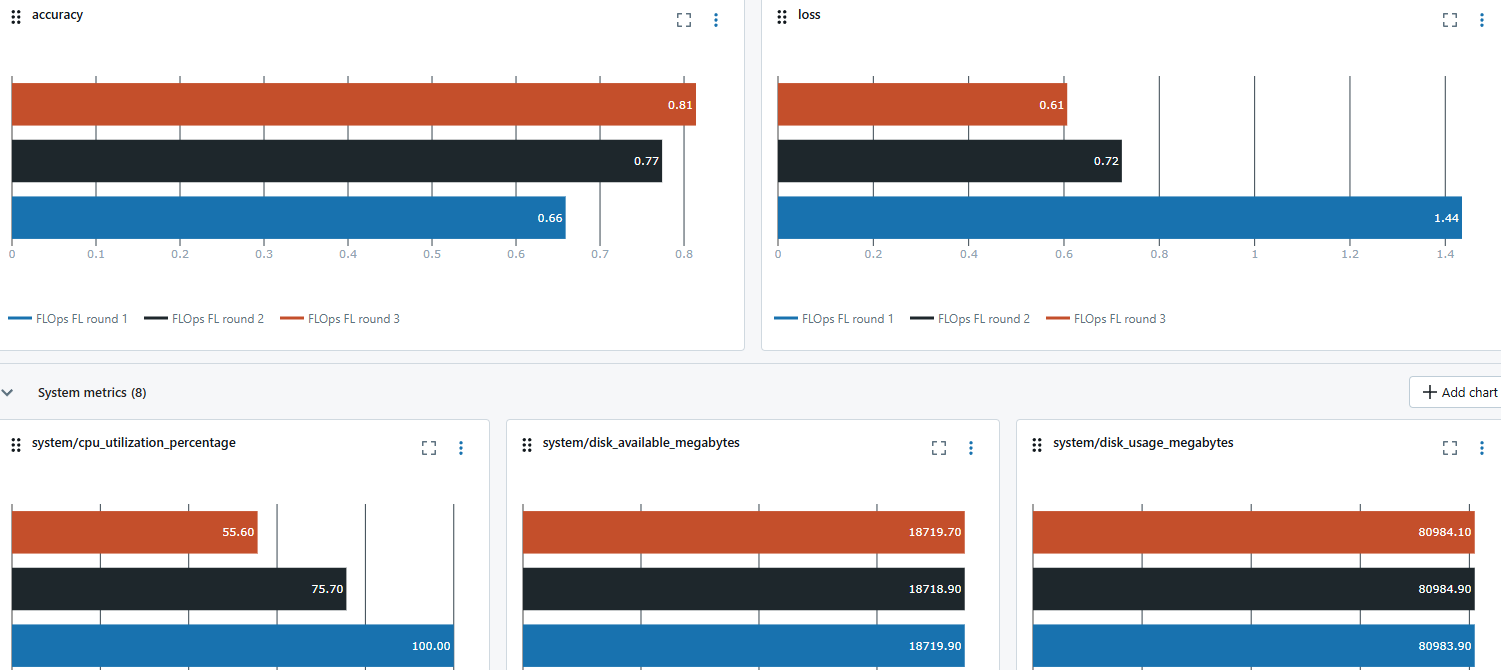
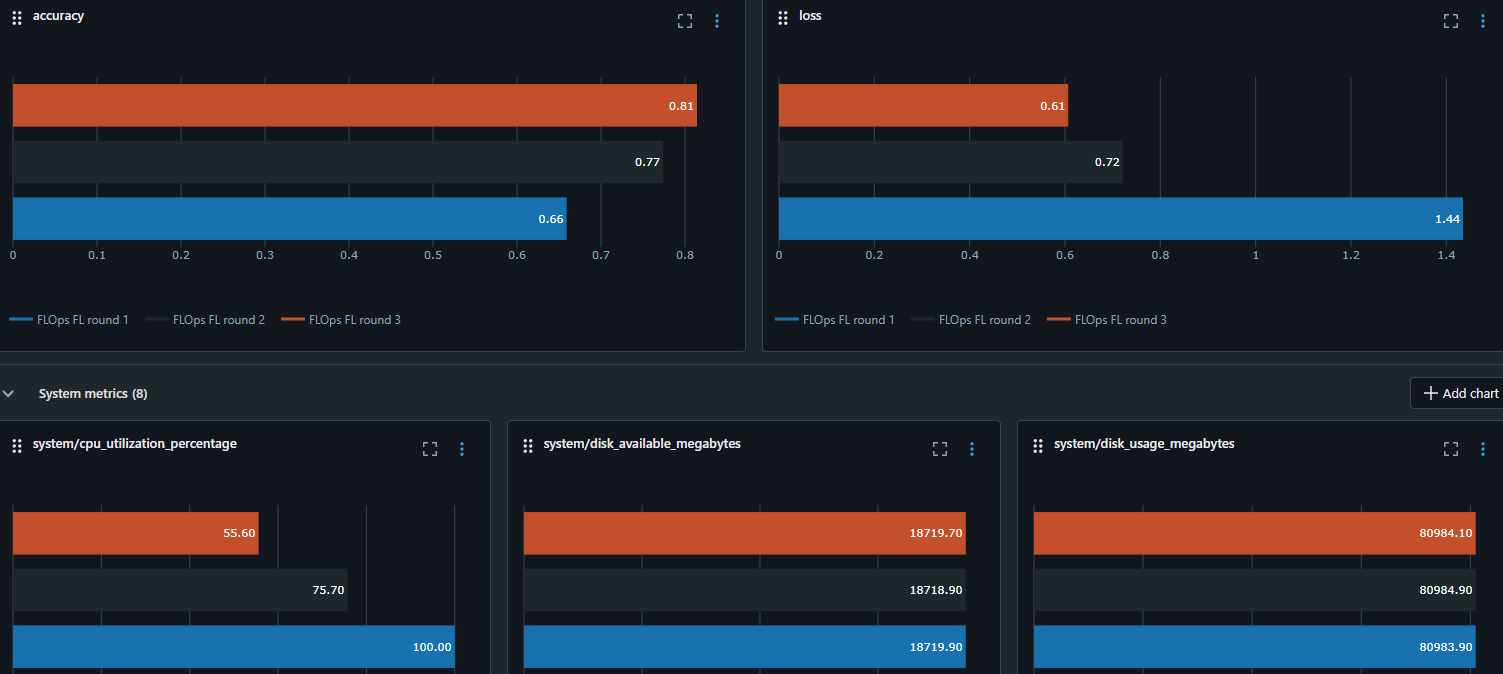
This page can also display the evolution of metrics, such as accuracy or system metrics. Currently, FLOps focuses on the model’s accuracy and loss. It shows that the model’s accuracy improved, and its loss decreased over time.
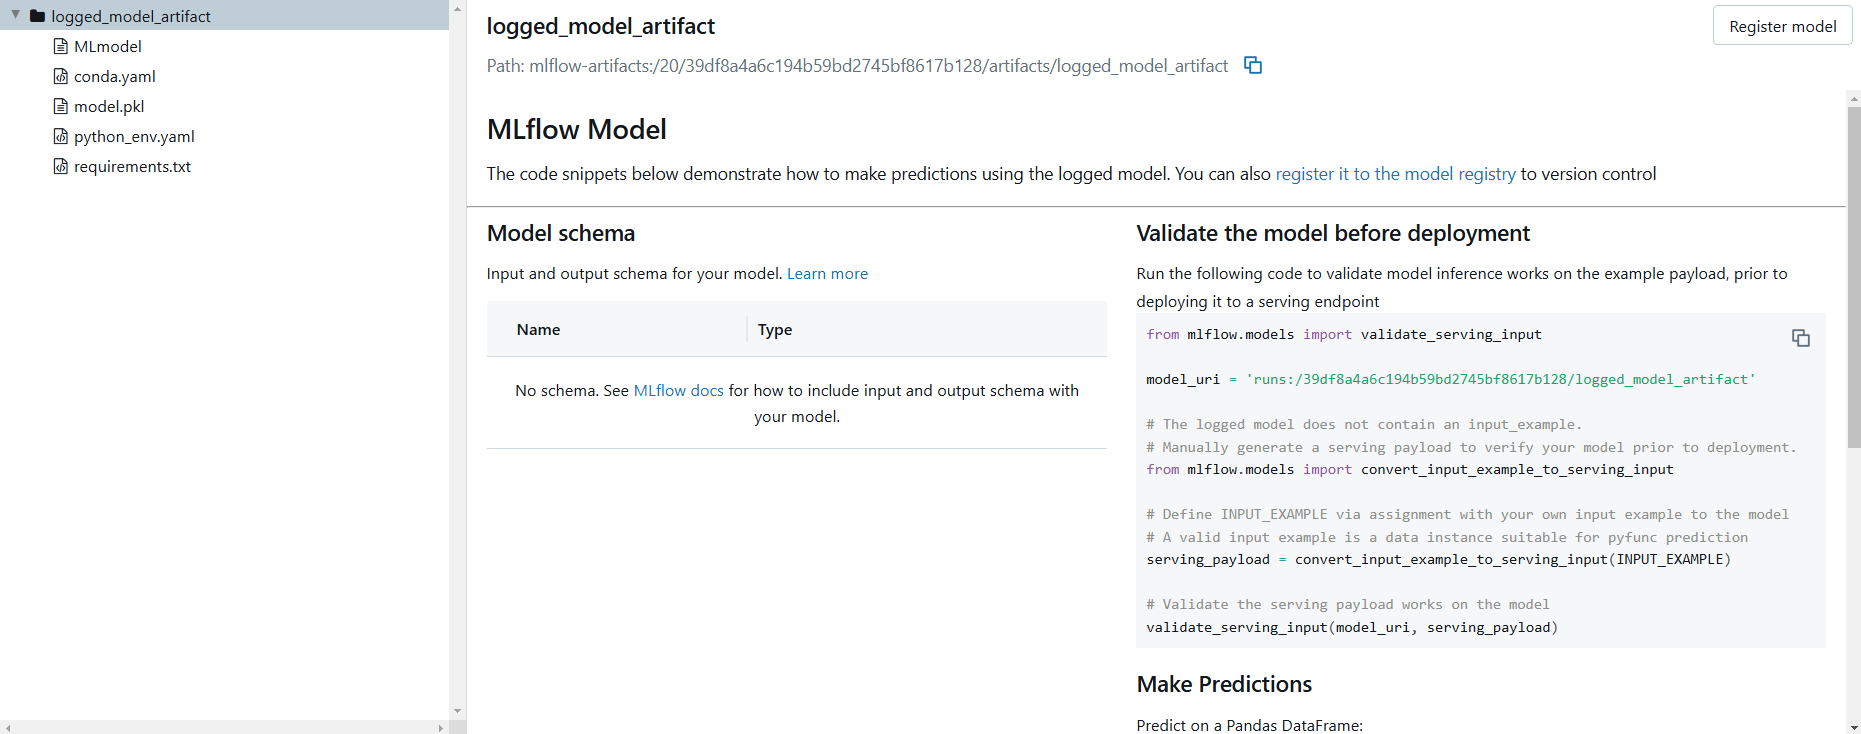
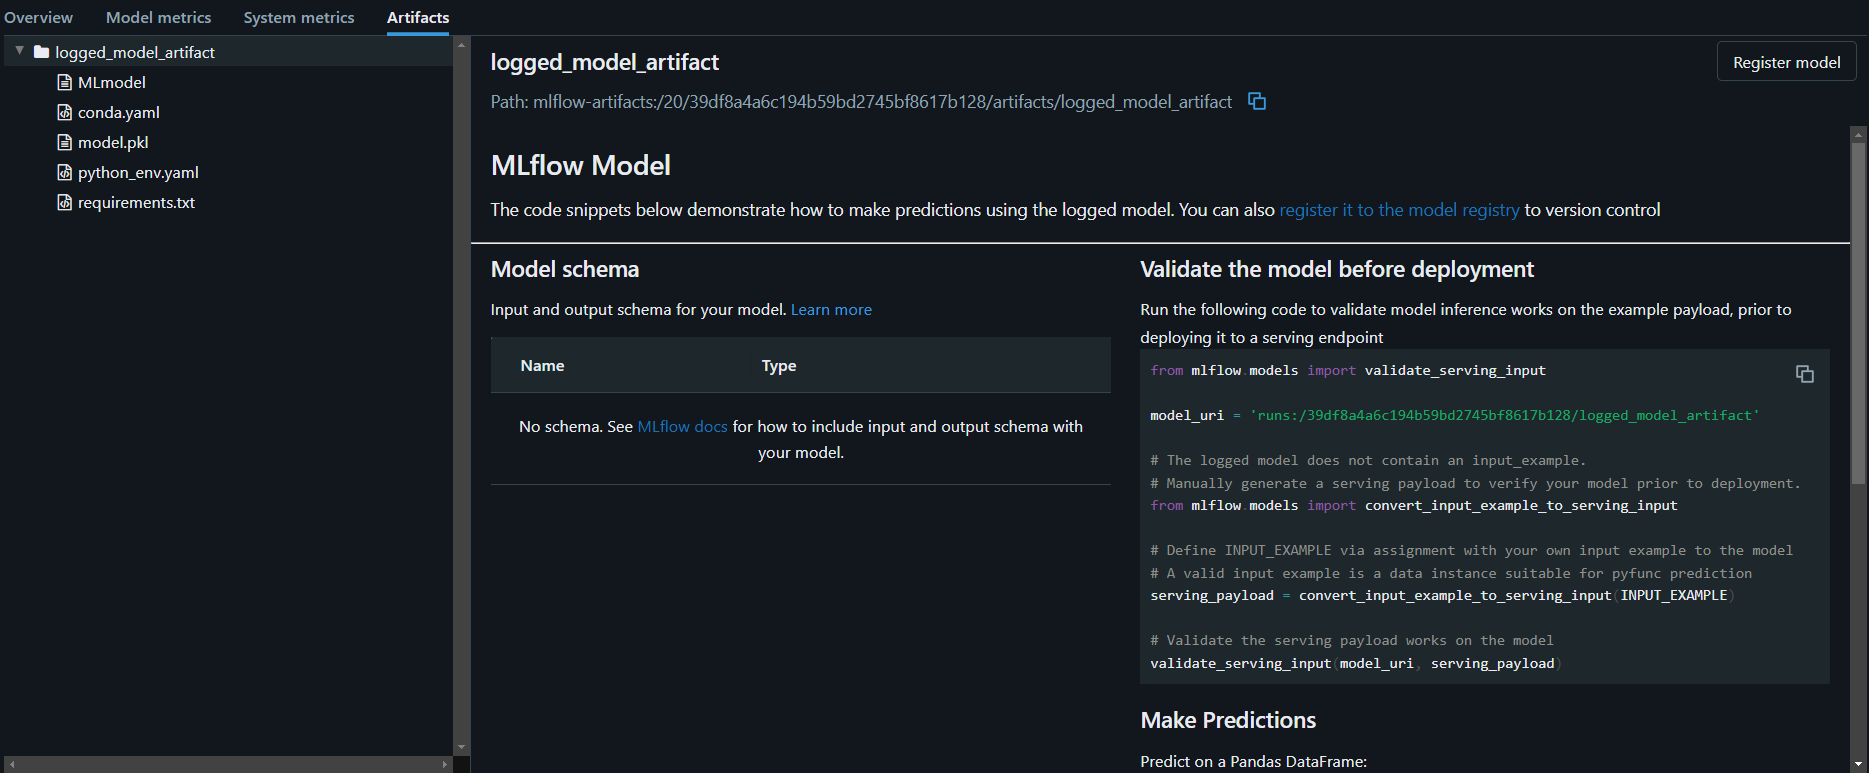
The left folder shows the different aspects that were recorded. The model requirements, conda environment, and model (pkl) file are all present. MLflow’s GUI directly supports in-build techniques to compare, analyze, and visualize these logged results. All of these recorded properties can be exported and shared with other people.
How exactly does FLOps use MLflow for elevating its MLOps capabilities?
Learn how FLOps integrates MLflow into its architecture and workflows here.
